Spot Trends Instantly: Heat Map Now in Entry Reports Pro
Heat map visualisation has finally arrived.
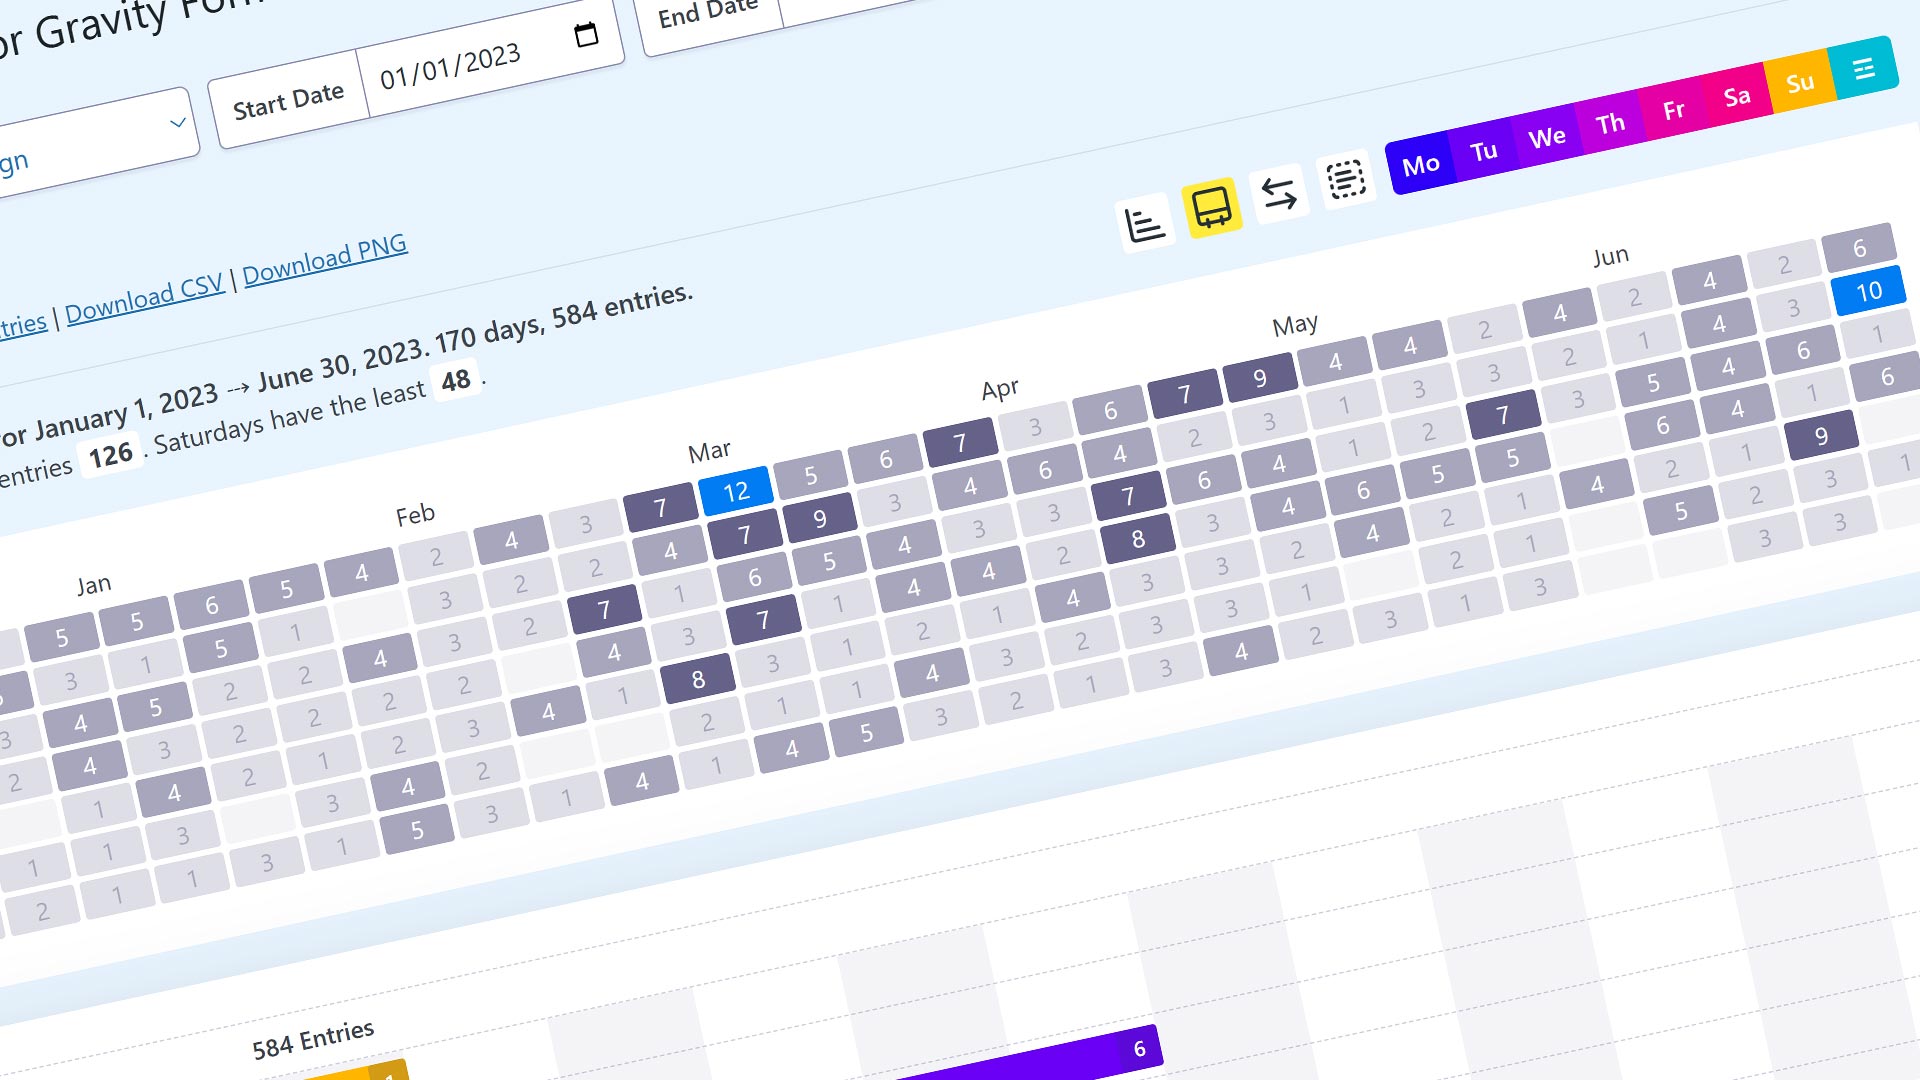
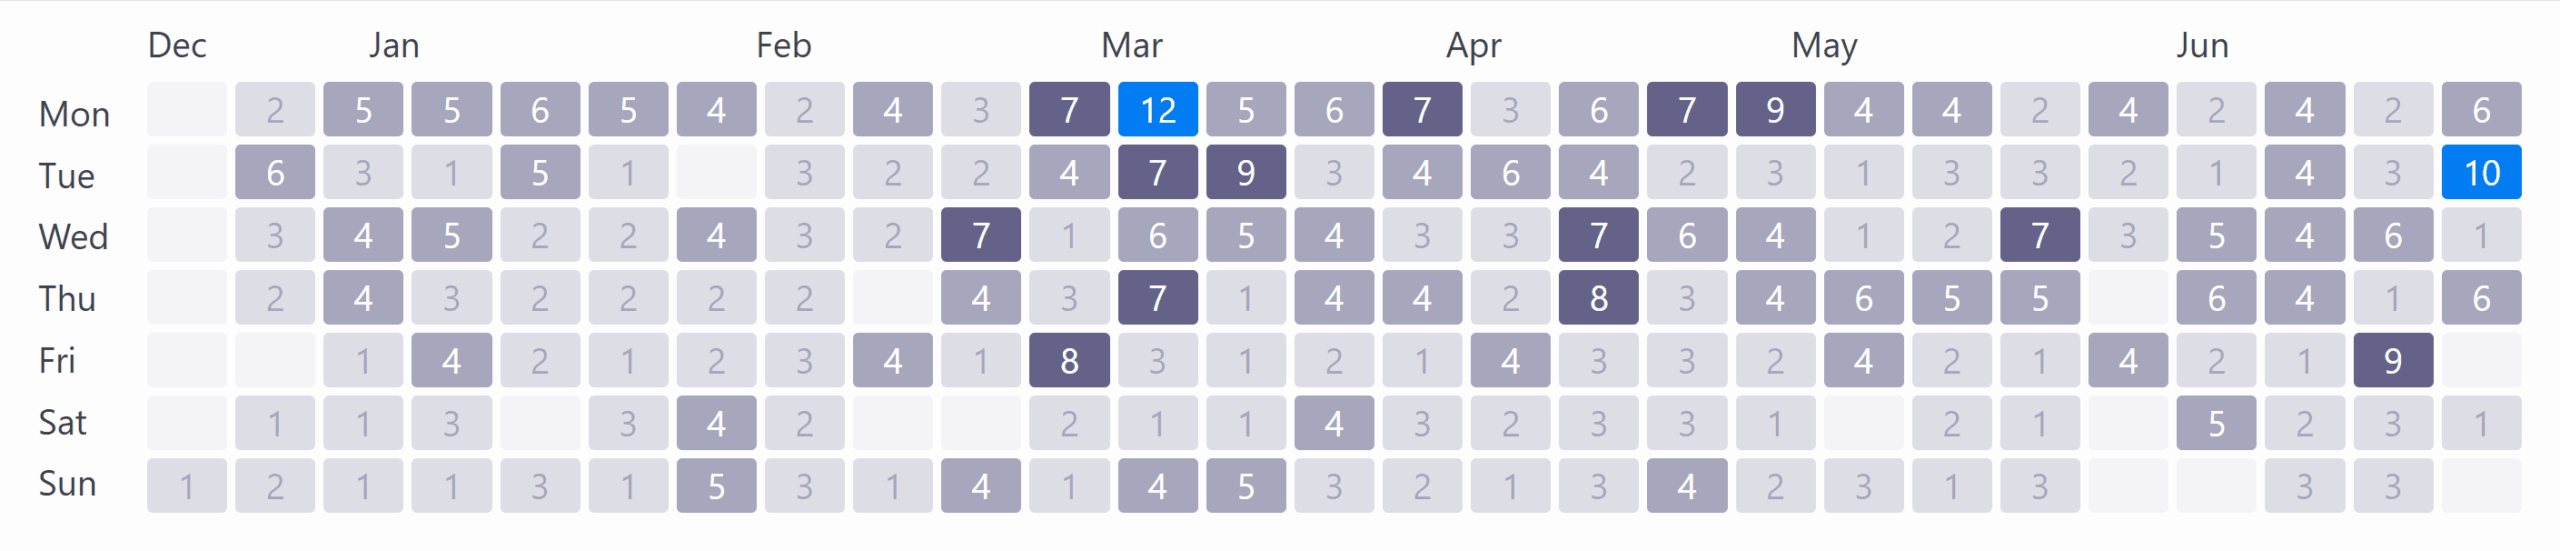
As of version 1.8.0, Entry Reports Pro for Gravity Forms introduces a heat map, inspired by the GitHub commit chart.
This new heat map offers a high-level overview of your form submissions, displaying daily activity with color-coded intensity so you can easily spot trends over time.
To enable it, go to Forms → Entry Reports Pro → General Options.
If you don’t see it yet, update now to unlock the feature!
Mike Ott
Michael is a veteran developer / web designer / usability evangelist, product engineer, former long time serving Judge for the annual Australian Web Awards and card carrying geek.
 The decades-long enshitification of the PayPal user experience
  Introducing New User Verify
  How I’m stopping spam bot signups, and how you can help
  Scheduled Email Reports Have Arrived
  The Metaverse is on Life Support