Spot Trends Instantly: Heat Map Now in Entry Reports Pro
Heat map visualisation has finally arrived.
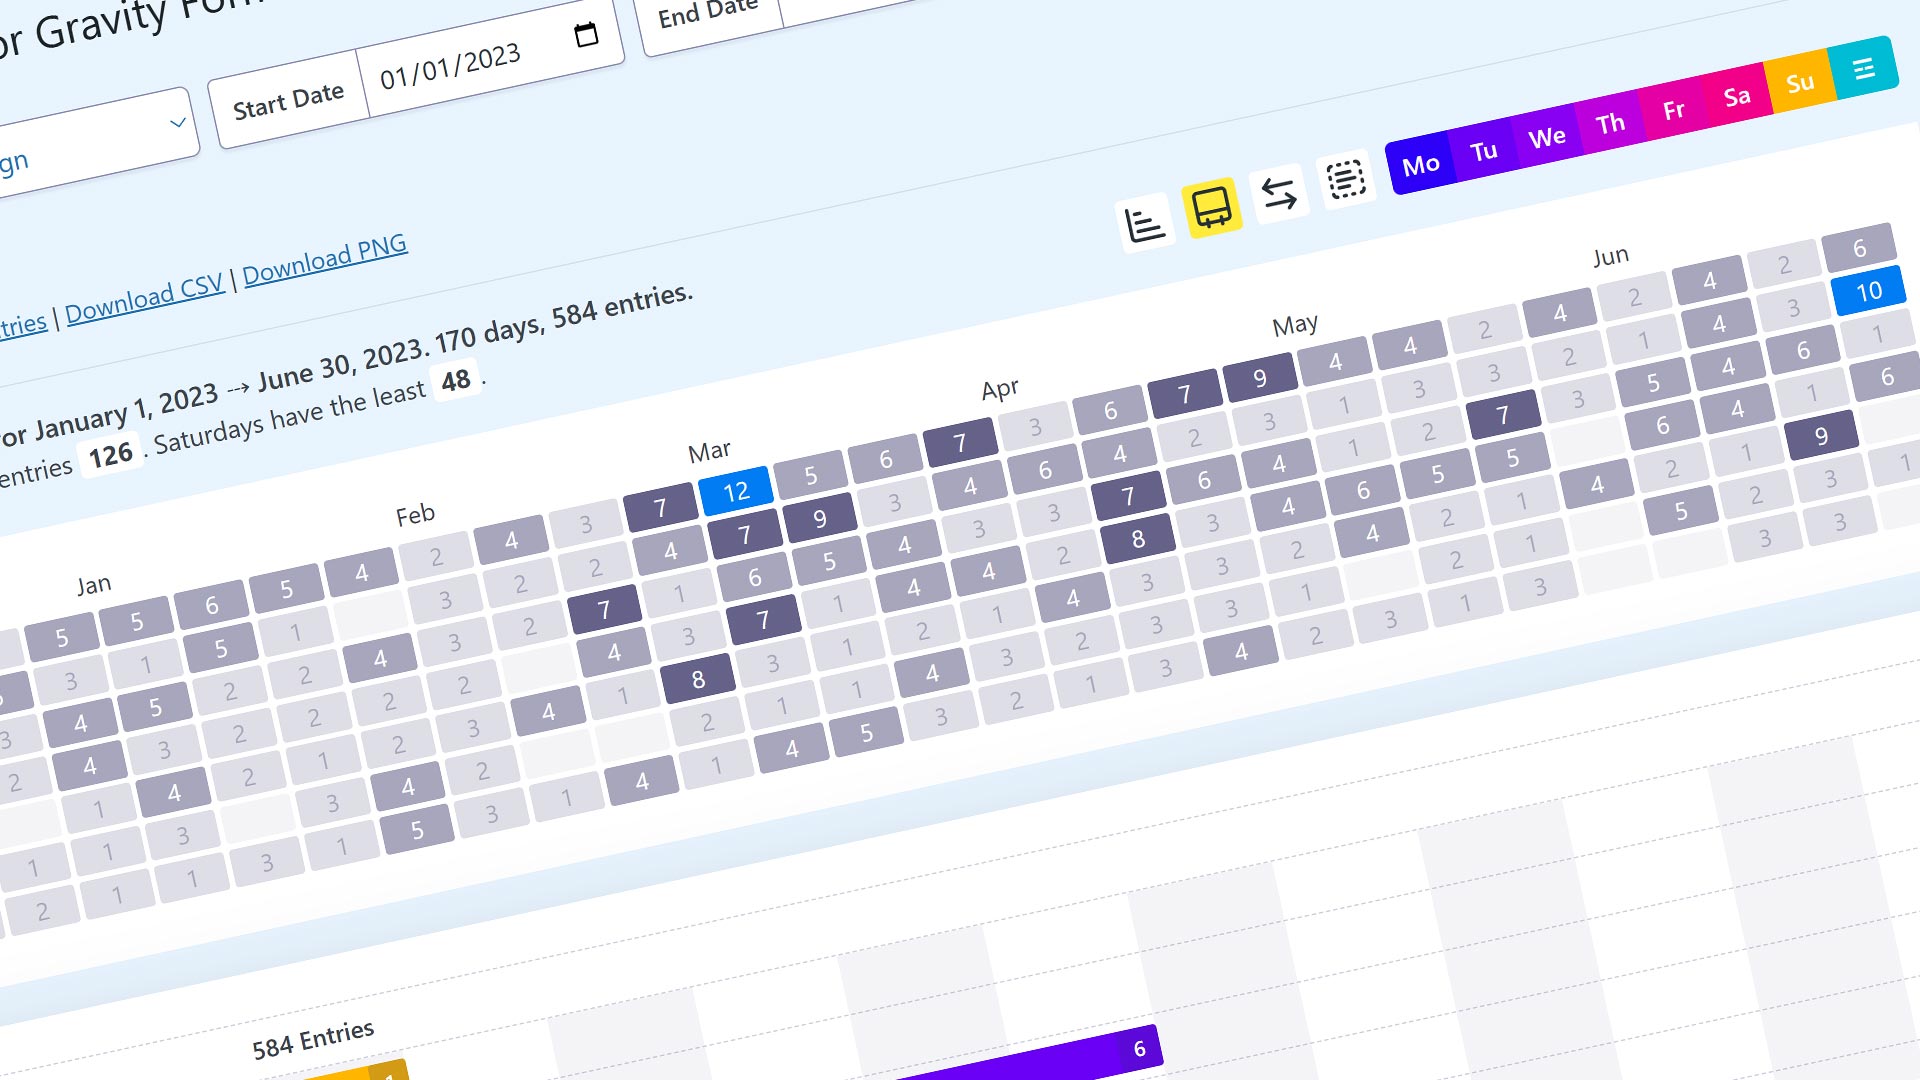
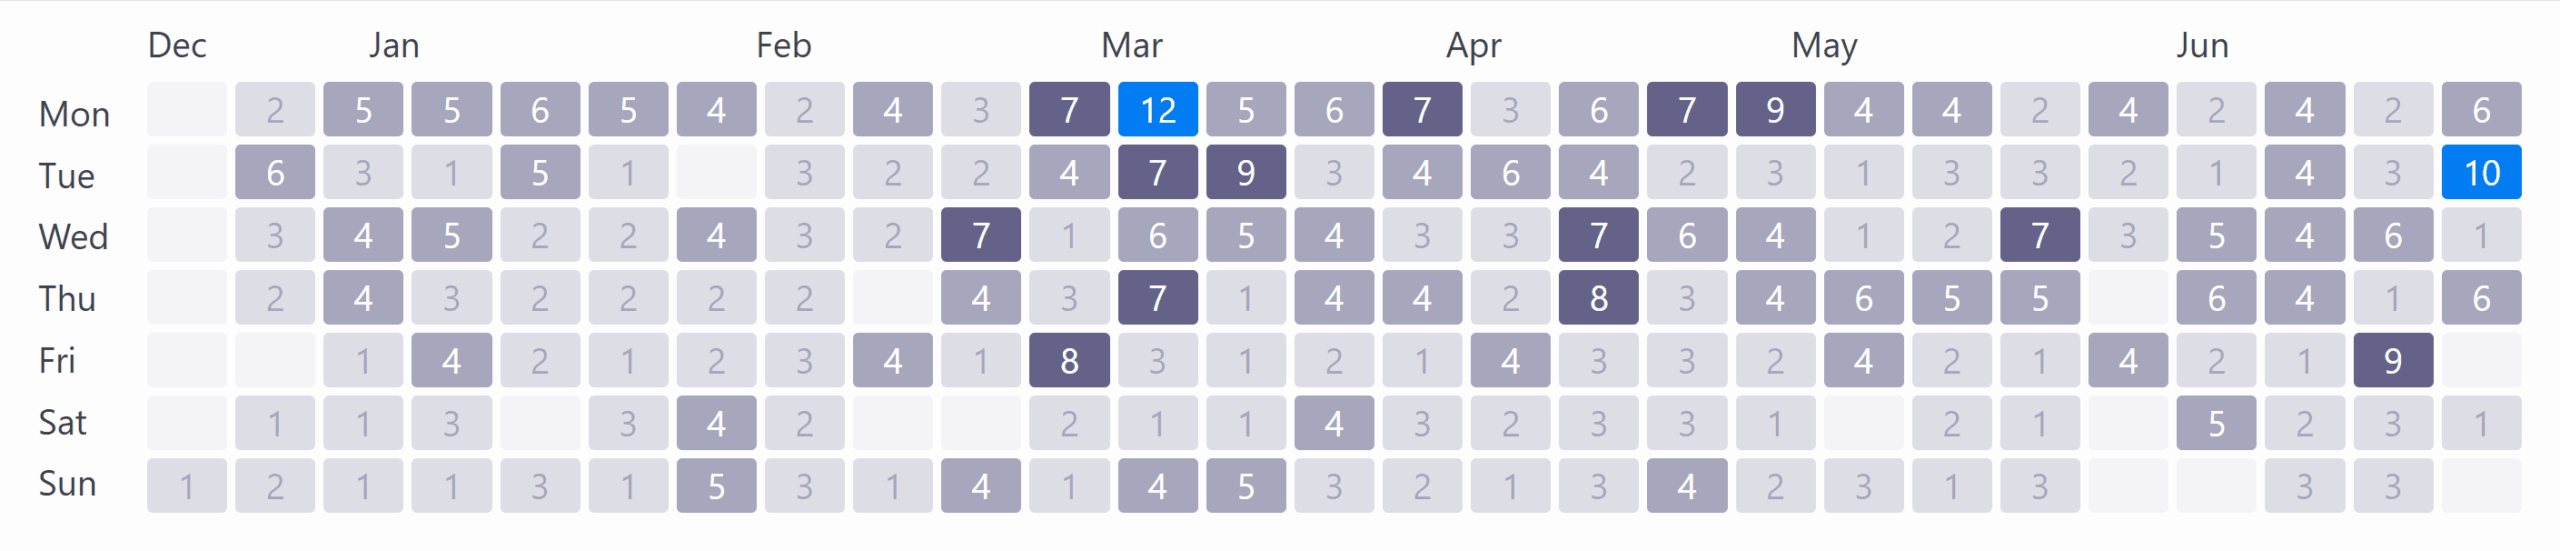
As of version 1.8.0, Entry Reports Pro for Gravity Forms introduces a heat map, inspired by the GitHub commit chart.
This new heat map offers a high-level overview of your form submissions, displaying daily activity with color-coded intensity so you can easily spot trends over time.
To enable it, go to Forms → Entry Reports Pro → General Options.
If you don’t see it yet, update now to unlock the feature!
Mike Ott
Michael is a veteran developer / web designer / usability evangelist, product engineer, former long time serving Judge for the annual Australian Web Awards and card carrying geek.


